NEW: 🛡️ 96.8% of stocks rated Very Safe kept their dividend intact. Read our study.


Invvest Valuation Chart:
do prices move back towards our “Fair Value”?
After more than 27,000 observations, here is how often prices actually ended up moving back towards our Fair Value.

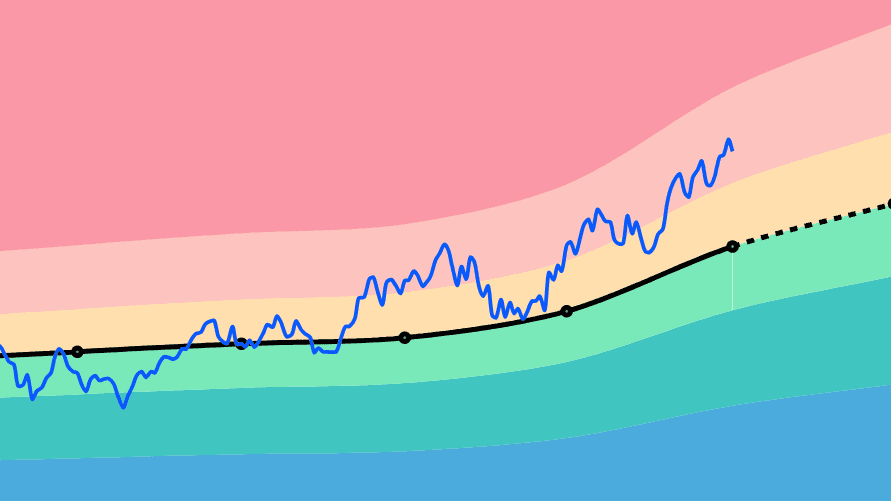
But a theoretical valuation model can fail in two ways:
- It predicts nothing: Prices move completely randomly without ever crossing the estimate.
- It “chases” prices: The model constantly readjusts its fair value to match the market after the fact, artificially proving itself right.
We wanted to test our algorithm against both pitfalls with a strict protocol: no hindsight bias and data completely frozen in time. Note that whenever a stock’s price, whether overvalued or undervalued, enters our Fair Value range, we call it a convergence.
of undervalued stocks moved upward within 2 years.
of undervalued stocks moved back into the Invvest Fair Value zone within 2 years.
median time observed for an undervalued stock to reach its Fair Value.
of convergences happened before any update to our Fair Value.
Test methodology
1. Quarterly snapshots
Every quarter, we took a snapshot of every stock with a market capitalization above $1 billion: its price, its Invvest Fair Value and its valuation band (Undervalued, Overvalued, Strongly undervalued, Strongly overvalued).
Each observation outside the Fair Value zone counts as an occurrence (more than 27,000 occurrences analyzed).
2. Strictly frozen target
Once the snapshot is taken, the Fair Value range is completely frozen for 12 to 24 months. It no longer takes subsequent earnings releases into account. Only the share price can move to close the gap.
3. Measuring convergence
We tracked the closing price every day. A convergence occurs as soon as the price enters the frozen Fair Value zone.
4. Honesty test
For each convergence, we checked whether it happened before or after the quarterly update of financial data on the live platform.
Results
Do prices converge towards our Fair Value?
US stocks data - Normal valuation thresholdsFor the moderate bands (Undervalued and Overvalued), nearly 8 out of 10 stocks move back into the Fair Value zone within two years.
Better still: for the stocks that converge, the median time it takes is only 6 weeks (41 to 43 days).
Who did the work? The honesty test
When the gap between a stock’s valuation and its theoretical Fair Value narrows on the platform, is it the price moving up/down towards our target, or our model lowering its target towards the price?
In 83.4% of convergences on undervalued stocks, the price reached the target before our algorithm even recalculated the theoretical value.
Breaking down the movement, 70% of all convergences are driven 100% by the share price. Our estimate stayed fixed and the market came back to it.
The special case of extreme gaps
The extreme bands (Strongly undervalued and Strongly overvalued) behave very differently.
The convergence rate drops to 32.7% for strongly undervalued stocks, and the median time jumps to more than 8 months (241 days).
Why? When a stock trades at more than a 50% discount to its historical fundamentals, the market is often anticipating a future deterioration that past figures have not yet reflected (the famous value trap).
In 41.8% of convergences for deep discounts, it was our estimate that had to be revised down to meet the deteriorated share price.
As for strongly overvalued stocks, the convergence rate is 41.79% within 24 months. This can be explained by a bubble effect, euphoria or some other factor that the fundamentals have not yet reflected.
Extending the study: Europe and tighter thresholds
We tested the model under two stricter configurations: by including European stocks and by using tighter tolerance thresholds (overvalued from 10% above Fair Value instead of 20%, strongly overvalued from 30% instead of 50%, undervalued from 10% below Fair Value instead of 20%, and strongly undervalued from 30% below instead of 50%).
Comparison of convergence rates within 24 months
The hierarchy remains fully intact in Europe and with tighter thresholds.
But as observed in the dividend study, adding European stocks slightly reduces convergence rates, mainly because financial data is published less frequently or is more fragmented.
What this study teaches us
Don’t blindly chase “extravagant” discounts: A stock showing a discount of more than 50% is not an obvious opportunity, but a risky one. Always check the Financial Health Score and analyze the fundamental reasons behind the gap before investing.
A framing tool, not a crystal ball: The Valuation Chart provides a solid statistical benchmark to identify temporary market anomalies and calibrate your entry and exit points.
Limitations of the study
Occurrences vs companies
A company that stays undervalued for 4 consecutive quarters counts as 4 separate episodes. Although these are 4 real entry points for an investor, it increases the total number of observations.
Possible survivorship bias
Delisted or bankrupt companies are flagged in the study, but some companies that dropped out of historical databases cannot be counted.
Market regimes
The study covers several years of recent historical data. We will repeat this study every year to measure the pull of Fair Value across complete economic cycles.
Special offer 🎁
To enjoy unlimited access to our Dividend Safety Scores for all stocks, we are offering you a 30% lifetime discount on the Invvest PRO annual subscription with the code:
ETUDE2026
Discount is available until October 20th 2026
The results presented in this study are based on retrospective historical observations. Past performance is not indicative of future results. This document is provided for information purposes only and in no way constitutes investment advice or an incentive to buy or sell financial assets.